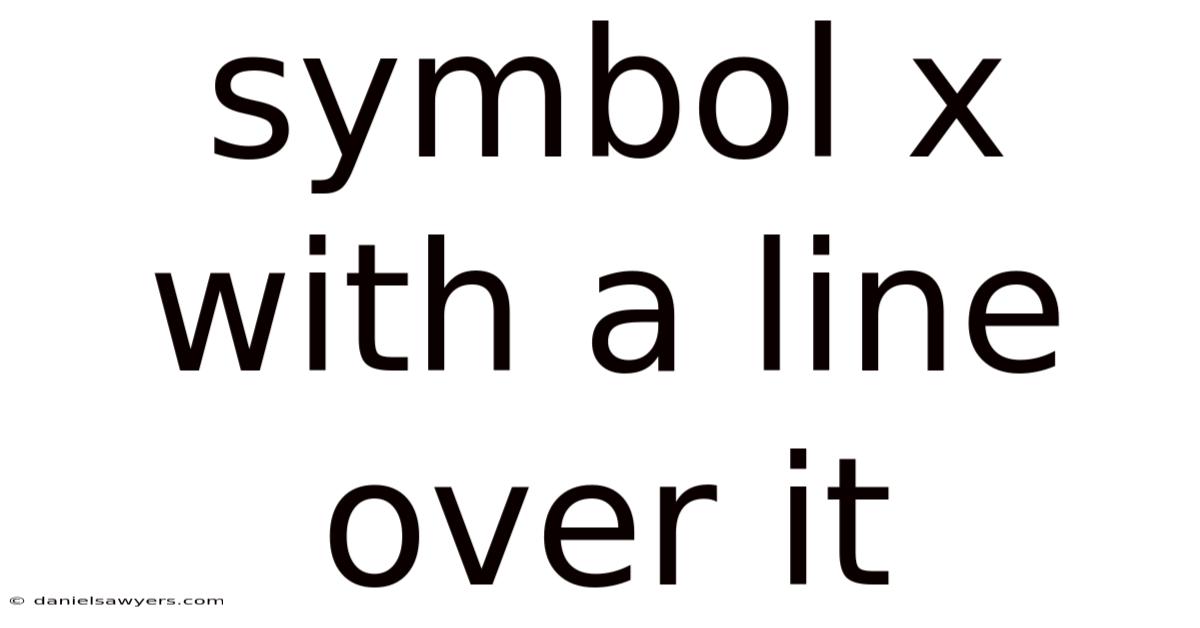
The symbol x with a line over it ($\bar{x}$, pronounced "x-bar") is one of the most fundamental notations in statistics and mathematics. While it appears simple—a lowercase x topped with a horizontal bar—its implications stretch across descriptive statistics, inferential analysis, probability theory, and even physics. Understanding this symbol is the gateway to interpreting data sets, calculating averages, and building the foundation for more complex statistical modeling Simple, but easy to overlook..
What Does the X-Bar Symbol Represent?
At its core, $\bar{x}$ represents the sample mean (or arithmetic mean) of a set of values. In statistical notation, the Latin letter x typically denotes a variable or a raw data point. When a horizontal line (called a macron or vinculum) is placed above it, the meaning shifts from a single observation to the average of all observations in a sample It's one of those things that adds up..
This distinction is critical. The sample mean ($\bar{x}$) serves as the best point estimate for the population mean ($\mu$, the Greek letter mu). In real terms, in statistics, we rarely have access to an entire population. Now, instead, we work with a sample—a subset of the population. If you see $\bar{x}$ in a formula, textbook, or research paper, it is almost exclusively referring to the average calculated from sample data It's one of those things that adds up..
The Mathematical Formula
The calculation behind the symbol is straightforward, yet it powers the entire field of inferential statistics. For a sample of size $n$ containing values $x_1, x_2, x_3, \dots, x_n$, the formula is:
$ \bar{x} = \frac{\sum_{i=1}^{n} x_i}{n} = \frac{x_1 + x_2 + \dots + x_n}{n} $
Where:
- $\sum$ (Sigma): The summation symbol, instructing you to add up all the values.
- $x_i$: Each individual data point in the sample.
- $n$: The sample size (the number of observations).
X-Bar vs. Mu: Sample vs. Population
One of the most common points of confusion for students is the difference between $\bar{x}$ and $\mu$. Both represent an "average," but their scope and certainty differ entirely.
| Symbol | Name | Data Source | Variability | Role |
|---|---|---|---|---|
| $\bar{x}$ (x-bar) | Sample Mean | A subset (sample) of the population | Variable (changes with every new sample) | Statistic (estimates the parameter) |
| $\mu$ (mu) | Population Mean | The entire population | Constant (fixed, though usually unknown) | Parameter (the true value we want to find) |
Why this matters: Because $\bar{x}$ is calculated from a sample, it is a random variable. If you take ten different samples from the same population, you will likely get ten slightly different $\bar{x}$ values. This concept—sampling variability—is the reason we need confidence intervals and hypothesis testing. We use the behavior of $\bar{x}$ (described by the sampling distribution of the mean) to make probabilistic statements about $\mu$.
The Central Limit Theorem and X-Bar
The behavior of $\bar{x}$ is governed by one of the most powerful theorems in statistics: the Central Limit Theorem (CLT). The CLT states that regardless of the shape of the population distribution (skewed, uniform, bimodal), the sampling distribution of the sample mean ($\bar{x}$) will approach a normal distribution as the sample size ($n$) increases.
This has profound implications:
-
- Center: The mean of the sampling distribution ($\mu_{\bar{x}}$) equals the population mean ($\mu$). 2. This makes $\bar{x}$ an unbiased estimator. Shape: For large $n$ (typically $n \ge 30$), the distribution of $\bar{x}$ is approximately normal. Spread: The standard deviation of the sampling distribution, known as the Standard Error of the Mean (SEM), is calculated as $\sigma_{\bar{x}} = \frac{\sigma}{\sqrt{n}}$ (or $\frac{s}{\sqrt{n}}$ if population standard deviation $\sigma$ is unknown).
This predictable behavior allows statisticians to use $\bar{x}$ to construct confidence intervals (e., "We are 95% confident the true mean lies between $\bar{x} \pm 1.g.96 \times SEM${content}quot;) and run t-tests or z-tests Not complicated — just consistent..
Other Contexts: Where Else Does X-Bar Appear?
While the sample mean is the dominant use case in introductory statistics, the "bar" notation (vinculum) has other specific meanings depending on the field.
1. Complex Conjugates (Mathematics/Engineering)
In complex analysis, a bar over a variable denotes the complex conjugate. If $z = a + bi$ (where $i = \sqrt{-1}$), then $\bar{z} = a - bi$. The real part stays the same, but the sign of the imaginary part flips. This is essential for calculating magnitudes ($|z| = \sqrt{z \bar{z}}$) and dividing complex numbers.
2. Logical Negation (Boolean Algebra / Digital Logic)
In digital circuit design and Boolean algebra, a bar over a variable represents the NOT operation (logical negation) The details matter here..
- If $X = 1$ (True), then $\bar{X} = 0$ (False).
- If $X = 0$ (False), then $\bar{X} = 1$ (True). You will often see this in logic gate diagrams (e.g., a NAND gate output is $\overline{A \cdot B}$).
3. Closure (Topology / Set Theory)
In topology, a bar over a set $A$ (written $\bar{A}$ or $\text{cl}(A)$) denotes the closure of the set—the set $A$ combined with all its limit points (boundary points) That's the part that actually makes a difference..
4. Antiparticles (Particle Physics)
In high-energy physics, a bar over a particle symbol indicates its antiparticle.
- Proton: $p$ $\rightarrow$ Antiproton: $\bar{p}$ (p-bar).
- Neutron: $n$ $\rightarrow$ Antineutron: $\bar{n}$.
- Quark: $q$ $\rightarrow$ Antiquark: $\bar{q}$.
5. Phonetics (Linguistics)
In the International Phonetic Alphabet (IPA), a macron over a vowel (e.g., $\bar{a}$, $\bar{e}$) historically indicated a long vowel sound, though modern IPA often uses the triangular colon ː (e.g., [aː]) for length Simple, but easy to overlook..
Calculating X-Bar: A Step-by-Step Example
Let’s ground the theory with a concrete calculation. Imagine a researcher records the daily coffee consumption (in cups) of 5 office workers: {2, 1, 3, 2, 4}.
Step 1: Identify $n$ (Sample Size) Count the data points. $n = 5$.
Step 2: Calculate the Sum ($\sum x_i$) $2 + 1 + 3 + 2 + 4 = 12$.
Step 3: Divide by $n$ $ \bar{x} = \frac{12}{5} = 2.4 $
Interpretation: The average coffee consumption for this specific sample is 2.4 cups per day. Note that no single person drank exactly 2.4 cups; the mean is a theoretical balancing point of the data The details matter here..
